Badges
Overview
Badges are little indicators (similar like number of messages on mobile phone icons) providing a quick way to show data and capture your attention.
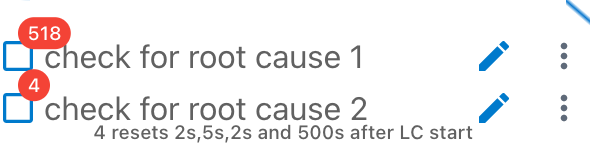
Example picture with root cause 1 with upper badge and root cause 2 with both upper and lower badge.
Each root-cause supports two badges:
- upper left badge. Shown in red color.
- lower left badge. Shown in secondary color.
Badges receive their info from currently two sources:
- DLT-Logs extension
- https rest-queries.
The badges are only shown if the checkbox is unchecked or marked as error.
The upper badge is configured to not show if the returned value is the number 0 and is limited to 999. The lower badge will show the 0 and is limited to 99. If you want to show it anyhow or show higher numbers see examples on how to convert to the string '0'.
The text from badges is truncated to max 40 chars. A tooltip is available showing the full text.
Badges using DLT-Logs extensions
With DLT-Logs extension the following use-cases are supported:
Show information in any of the badges:
- based on number of messages matching a set of DLT-filters on the currently opened DLT-file
- based on message attributes usually from the first message filtered
- based on applying a user-defined Javascript on the messages returned from a query of a set of DLT-filters.
To use a badge perform the following steps:
- edit a root-cause (press the small pen icon on a root cause in the fishbone or click on the text of the root cause)
- press the edit upper left badge or lower right badge* button
- select the extension dlt-logs rest query button
- press the OPEN DLT FILTER ASSISTANT... button
- select the filters you want to use on the right hand side All available filters:.
If the list is empty you do need to open a DLT log file and configure your filters there first.
-
press the
<button to move those filters to the Selected filters: list. -
press SAVE CHANGES
-
specify the "jsonPath" expression to extract results. For the "number of messages" use-case the jsonPath expression is already prefilled. See (todo) for details.
-
select whether you want to use
- number of array elements or
- data from first element or
- a javascript function
to get the data out of the returned DLT-filter results.
Manual edit of DLT query
You can as well use the EDIT MANUALLY button to directly change the rest query performed. The DLT-Logs rest query api supports the following commands:
| command name | description |
|---|---|
query | Used to apply a query for dlt messages. The expected parameter is an array of filter objects. For a filter object attributes see filter reference. Query should be used for all badges. If multiple filters are queried the usual rules apply (e.g. positive filters are or'd) except that for no filter no messages are returned. |
sequences | Used to define and execute sequence detection. The expected parameter is an array of sequence objects. For Details see sequences. |
disableAll, enableAll | Used to disable/enable all filters of a certain type. The expected parameter is any of view (pos or neg), pos (positive filters), neg (neg. filters), marker(marker). Used only for apply filter button. |
report | Used to generate a report. The expected parameter is an array of filter objects. Used only for apply filter button. |
add | Used to add a filter. The expected parameter is a filter object. Those filters are not persisted. Hint: use e.g. an attribute like "tmpFb":1 to identify those filters easily for a later delete(see below). Used only for apply filter button. |
delete | Used to delete a filter. The expected parameter is an object with filter attributes. All matching filter will be deleted. The main use-case is to delete temporary filters that are added via add. Used only for apply filter button. |
Data returned from a DLT-Logs rest query:
The returned data from a rest query is in general a JSON object.
For a query with DLT-filters it's typically in the form of an object with a key data that is an array of messages like:
{
  "data": [
    {
        "id": 10,
        "type": "msg",
        "attributes": {
            "timeStamp": 18283269,
            "ecu": "ECU1",
            "apid": "SYS",
            "ctid": "CTI1",
            "payloadString": "Example SYS CTI1 message payload...",
            "lifecycle": 1585216860833.6
        }
    },
    {
        "id": 68,
        "type": "msg",
        "attributes": {
            "timeStamp": 18304306,
            "ecu": "ECU1",
            "apid": "SYS",
            "ctid": "CTI1",
            "payloadString": "Another example SYS CTI1 message payload...",
            "lifecycle": 1585216860833.6
        },
    }
    // more msgs to follow
    ]
}
Maximum number of DLT query messages returned: maxNrMsgs
By default a DLT-logs query returns a maximum of 1000 messages. In general this should be sufficient for the intended use-cases by using filters restricting the results. If you have use-cases where this is not sufficient you can increase the limit or even disable the limit by adding the maxNrMsgsattribute to any filter of the query. E.g.
/get/docs/0/filters?
query=[
  {
    "maxNrMsgs": 0, // 0 = unlimited, 1000 default
    "type": 0,
    "payload": "foo.*",
    "ctid": "FOOD"
  }
]
If multiple filters specify maxNrMsgs the maximum value is used (0 counted as highest number).
Please consider that this might impact heavily the processing time to calculate/update all badges. So please use sparingly where needed only.
Adding lifecycle info to the DLT query results: addLifecycles
By default a DLT-logs query returns an array of DLT logs as shown in Data returned. Each log info contains a lifecycle identifier as well that helps e.g. doing calculations like avg/min/max,... per lifecycle.
To support more complex use-cases e.g. to calculate the time distance from a certain message towards the end of the lifecycle "occurred xx sec before end of LC" you can request the lifecycle details as well.
To do so simply add addLifecycles to any filter of your query. E.g.
/get/docs/0/filters?
query=[
  {
    "addLifecycles": true, // defaults to false
    "type": 0,
    "payload": "foo.*",
    "ctid": "FOOD"
  }
]
The example data returned will then consist of both type lifecycles and type msg objects:
  "data": [
    {
      "type": "lifecycles",
      "id": 1585240865939.6,
      "attributes": {
        "index": 1,
        "id": 1585240865939.6,
        "ecu": "ECU1",
        "label": "3/26/2020, 5:41:05 PM-5:42:57 PM #10277",
        "startTimeUtc": "Thu, 26 Mar 2020 16:41:05 GMT",
        "endTimeUtc": "Thu, 26 Mar 2020 16:42:57 GMT",
        "sws": [], // list of sw versions detected
        "msgs": 10277 // nr of messages in this lifecycle (unfiltered)
      }
    },
    {
      "type": "lifecycles",
      "id": 1585240984260.5,
      "attributes": {
        "index": 2,
        "id": 1585240984260.5,
        "ecu": "ECU1",
        "label": "3/26/2020, 5:43:04 PM-5:46:25 PM #41519",
        "startTimeUtc": "Thu, 26 Mar 2020 16:43:04 GMT",
        "endTimeUtc": "Thu, 26 Mar 2020 16:46:25 GMT",
        "sws": [
          "ECU1 21w..." // sw version received.
        ],
        "msgs": 41519 // nr of messages in this lifecycles (unfiltered)
      }
    },
    // ... more lifecycle infos
    {
      "id": 10485,
      "type": "msg",
      "attributes": {
        "timeStamp": 63279, // relative timestamp in 0.1ms granularity to the lifecycle startTimeUtc. You can use Date(lifecycle.startTimeUtc).valueOf()+msg.timeStamp/10 to calculate the abs starttime in ms from UTC.
        "ecu": "ECU1",
        "apid": "DEAD",
        "ctid": "FOOD",
        "payloadString": "foo happened",
        "lifecycle": 1585240984260.5 // this can be used as an identifier/lookup to the returned lifecycles.id
      }
    },
    // ... more messages fitting to the filters.
  ]
The lifecycle infos are always the first objects in the results list and you can rely on the lifecycles being sorted by ecus first (if multiple ecus are present in the logs) then by time.
Json path details
As a first step of processing the returned object can be processed with a json path pre-processor.
E.g. to get the data array elements simply use:
$.data[*]
or if you're only interested in the attributes:
$.data[*].attributes
Dont use this with the addLifecycles feature. You'll loose the type info!
or for the payloadString:
$.data[*].attributes.payloadString
If you're not used to json path expressions there is a online evaluator available here jsonpath.
Javascript function details
If the the number of messages or the first element from the json path expression is not sufficient e.g. for use-cases like:
- calculate an average/min/max value
- calculate the distinct set of values e.g. different SW versions
- extract/shorten the result
- find lifecycles where messages matching exactly one of multiple filters
- ...
a user-provided javascript function body can be entered.
The function prototype is in the form of:
function (result: object|any[] ):string|number|object {
    <body text>
}
It's actually created, called and evalued internally with:
    const fn = new Function("result", '<entered body text>');
    const fnRes = fn(result); // call the function
    switch (typeof fnRes) { // which type was returned:
        case 'string': answer.convResult = fnRes; break;
        case 'number': answer.convResult = fnRes; break;
        case 'object': answer.convResult = JSON.stringify(fnRes); break;
    ...
The result from the rest query or if provided from the json path processor is passed to the javascript function as result parameter.
You can use JSON5.parse(...) from inside the function body to parse e.g. JSON strings with comments or hex numbers.
Javascript function examples
See here a few examples:
- provide from the first 3 results the substring from index 10 to 15 separated by ',':
return result.slice(0,3).map(r=>r.slice(10,15)).join(',');
- show 0 for number of message, i.e. convert to string as result:
return result.length.toString();
todo ... add more examples.
URI-De-/Encoder
As the communication from fishbone extension to DLT-Logs extension is via a rest-api alike "restQuery" the query gets transmitted and stored in a URI encoded format.
To ease decoding and fast manual edits you can enter/modify the query below or use the EDIT MANUALLY... button:
Badges using https rest-queries
todo add example